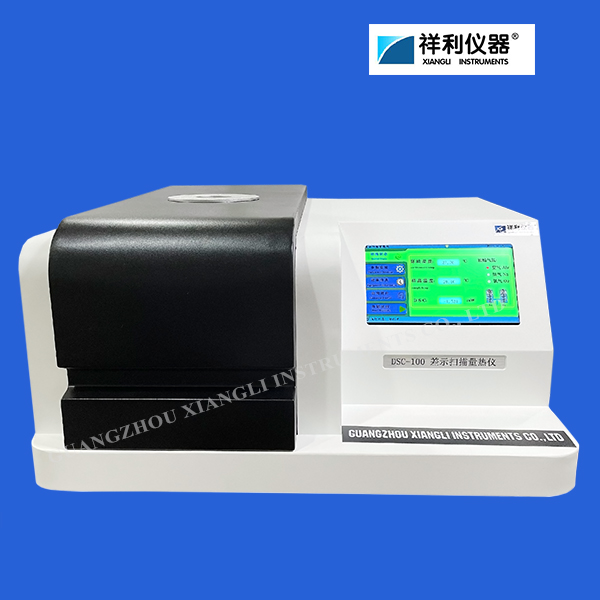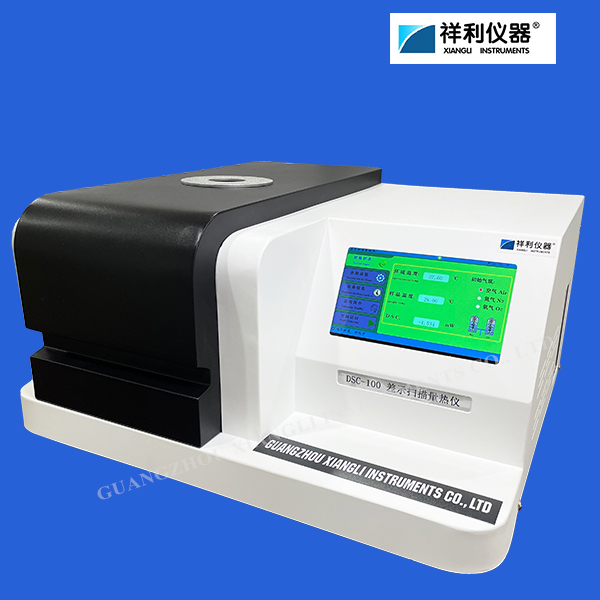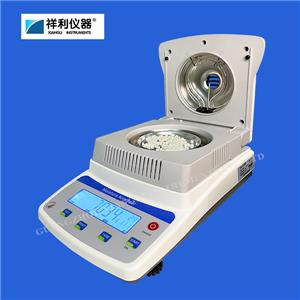
DSC-100 Differential Scanning Calorimeter
Brand :XIANGLI
Product origin :CHINA
Delivery time :3 days
Supply capacity :1000
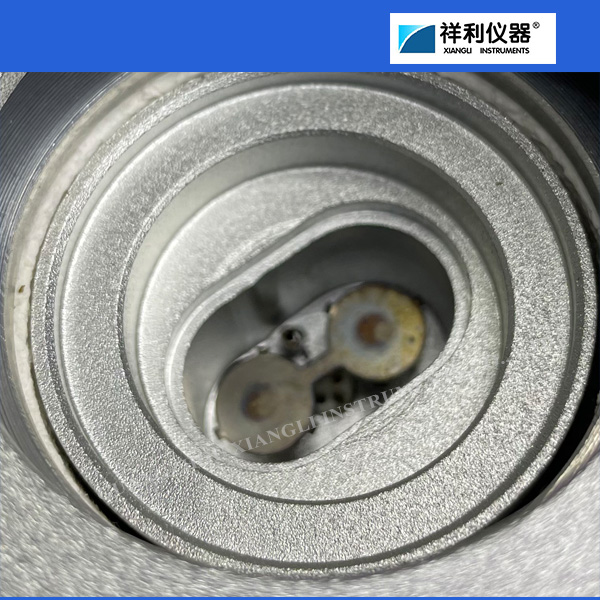
This DSC hasNew furnace structure, better resolution, resolution and baseline stability.
Instrument offline computer data real-time transmission, interface friendly, easy to operate.
Product specification
★ Differential scanning calorimetry (DSC) is a technology that has been widely used.
★ Differential scanning calorimeter is both a routine quality testing tool and a research tool.
★ What measured is the relationship between temperature and heat flow related to the thermal transition within the material.
★ Our company's instrument is a heat flow type differential scanning calorimeter, which has the characteristics of good repeatability and high accuracy, and is especially suitable for precise measurement of specific heat.
★ The equipment is easy to calibrate, has a low melting point, is fast and reliable, and has a wide range of applications, especially in material research and development, performance testing and quality control.
★ Material properties such as glass transition temperature, cold crystallization, phase transitions, melting, crystallization, product stability, solidification/cross-linking, oxidation induction period, etc. are areas of research for differential scanning calorimetry, based on experimental parameters and Choose different models according to experimental needs.
Application
The curing reaction temperature and thermal effect of polymer materials, the measurement of material phase transition temperature and its thermal effects, the determination of the crystallization and melting temperature of polymer materials and their thermal effects, the glass transition temperature of polymer materials, etc.
Detection method
▅ Put the sample and reference substance into the crucible respectively, place them in the furnace for programmed heating, and change the temperatures of the sample and reference substance.
▅ If the heat capacity of the reference object and the sample are the same and there is no thermal effect on the sample, the temperature difference between the two will be almost "zero", and a smooth curve will be obtained. As the temperature increases, the sample produces a thermal effect, but the reference material does not produce a thermal effect. A temperature difference occurs between the two, which appears as a peak in the DSC curve. The greater the temperature difference, the larger the peak, and the greater the number of temperature difference changes. The more, the more the number of peaks. The peak with the top of the peak pointing upward is called the exothermic peak, and the peak with the top of the peak pointing downward is called the endothermic peak.
▅ The figure below is a typical DSC curve, which shows four types of transitions.
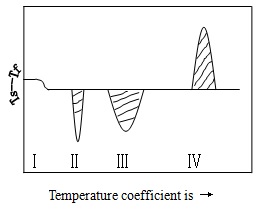
ⅠFor a secondary transition, it is a change in the horizontal baseline
Ⅱ For the heat absorption peak, it is caused by the melting or melting transition of the test sample
Ⅲ For the heat absorption peak, it is caused by the decomposition or cleavage reaction of the test sample
Ⅳ is the exothermal peak, which is the result of the sample crystalline phase transition
Working principle
▄ Materials are often accompanied by thermal effects during physical and chemical changes. The exothermic and endothermic phenomena reflect changes in the thermal enthalpy of materials. The differential thermal analyzer measures the temperature difference between the sample and the reference material as a function of temperature or time under the same heating conditions.
Differential scanning calorimetry is a technology that measures the relationship between the power difference and temperature of an output substance and a reference substance under program-controlled temperature. Our company's instrument is a heat flow differential scanning calorimeter. The ordinate is the heat flow difference between the sample and the reference material, and the unit is mw. The abscissa is time (t) or temperature (T), and growth is from left to right (if it does not meet this requirement, it should be noted).
After the sample and reference substance are put into the crucible, the temperature rises at a certain rate. If the heat capacity of the reference substance and the sample is approximately the same, an ideal scanning calorimetric analysis chart can be obtained.
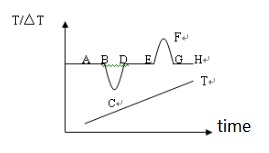
“T” in the figure is the temperature curve reflected by the thermocouple inserted on the reference object.
“AH” line reflects the temperature difference curve between the sample and the reference material. If no thermal effect occurs in the sample, then ΔT=0 between the sample and the reference substance, then a smooth baseline like AB, DE, and GH on the curve will appear. When a thermal effect occurs and the temperature of the sample is lower than that of the reference substance, an endothermic peak such as a downward BCD peak will appear. On the contrary, an EFG exothermic peak with an upward peak appears.
The number, position, peak area, direction, height, width, and symmetry of the peaks in the figure reflect the number of physical and chemical changes that occurred in the sample within the measured temperature range, the temperature range in which the transformation occurred, and the size of the thermal effect. and positive and negative. The height, width, and symmetry of the peak are not only related to the test conditions but also to the dynamic factors during the sample change process. The measured results are much more complicated than the ideal curve.
Instrument characteristics
1.New furnace structure, better resolution, resolution and baseline stability.
2.instrument offline computer data real-time transmission, interface friendly, easy to operate.
Product parameter
| DSC | DSC-100 Differential scanning calorimeter |
| DSC range | 0~±600mW |
| Temperature range | room temperature~ 600℃ |
| Heat-up rate | 0.1~100℃/min |
| Temperature resolution | 0.001℃ |
| Temperature fluctuations | ±0.001℃ |
| Temperature reproducibility | ±0.1℃ |
| DSC accuracy | 0.001mW |
| DSC sensitivity | 0.01uW |
| Temperature control method | Heating up and constant temperature (automatic control of the whole program) |
| Curve scan | Heating up the scan |
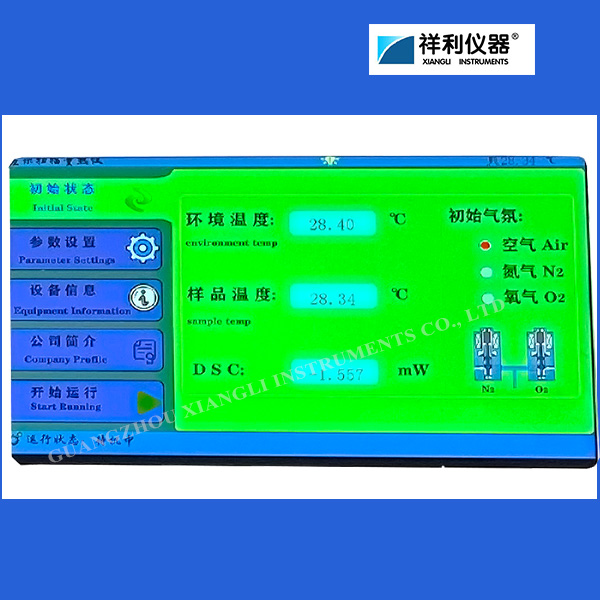
| Air control | The instrument switches automatically |
| Display mode | The 24bit color 7-inch LCD touchscreen display is shown |
| Data interface | Standard USB interface |
| Instrument standards | Equipped with standard substances (Sn), the user can correct the temperature and thermal enthalpy |
| Note | All technical indicators can be adjusted according to the user needs |
Maintain
1. Open the machines everyday periodically.
2. Operated by the specialist.
3. The equipment and accessories must be deposit in the dry environment.
4. After testing the accessories should be added wiping grease rust, and remove the rust great before test.
5. When the test finished, the power should be closed to avoid any accident.
Certificate


